
- A Comparison of the Folkestone and Market Rasen Earthquakes
- Revised Seismic Hazard Maps for the UK
- Seismogenesis and State of Stress in the UK
- Monitoring Volcanic Eruptions Using Interferometry
- Particular events
- Are yesterday's earthquakes tomorrow's disasters?
- Creating 'virtual seismometers' deep inside the Earth
- Fault line living
- Is earthquake activity related to the Moon or Sun?
- Is earthquake activity increasing?
Analysis of the Buncefield Oil Depot Explosion 11 December 2005
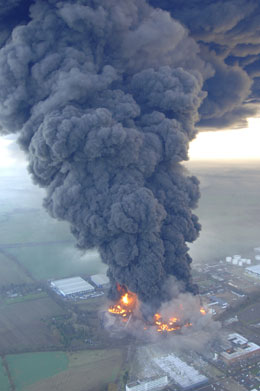
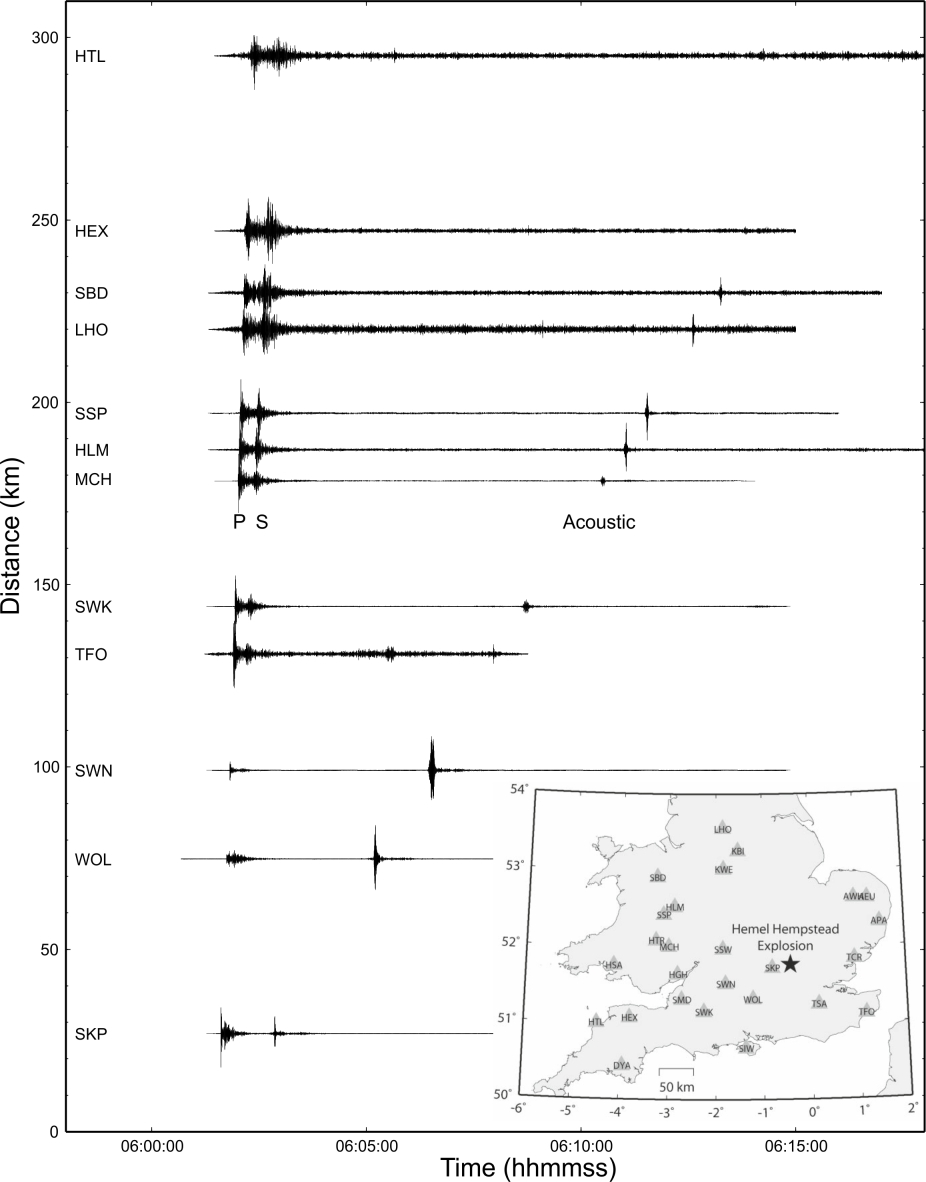
A massive vapour cloud explosion occurred at the Buncefield fuel depot near Hemel hempstead, UK, in the morning of 11 December 2005. The explosion was caused by an overflow from one of the storage tanks resulting in the release of over 300 tons of petrol. As a result, a vapour cloud spread over an area of 80,000m2, which was ignited and exploded. Considerable damage was caused in the vicinity of the explosion and a total of 43 people were injured. The explosion was detected on seismograph stations in the UK and the Netherlands and on infrasound arrays in the Netherlands. We analysed the seismic recordings to determine the origin time of 06:01:31.45 +/-0.5 sec (UTC) from P-wave arrival times. Uncertainties in determination of origin time from accoustic arrival times alone were less than 10 seconds. Amplitudes of P-, Lg-wave and primary accoustic waves were measured to derive decay relationships as a function of distance. Seismic amplitudes were also used to estimate the explosion yield. The seismic stations recorded primary and secondary acoustic waves. We used atmospheric ray-tracing to identify the various travel paths, which depend on temperature and wind speed as function of height, leading to directional variation. Refracted waves were observed from the troposphere, strotosphere and thermosphere with a good match between observed and calculated travel times. The various waves types were also identified through array processing, which provides back-azimuth andf slowness, of recordings from an infrasound array in the Netherlands. The amplitude of statospheric refracted accoustic waves recorded on the array microbarometers was used to estimate a yield of 29.5 tons TNT equivalent. However, the uncertainty attached may be as large as one order of magnitude, based on the observed seismic magnitudes as a function of yield from quarry blasts. We have demonstrated through joint seismo-acoustic analysis of the explosion that both the seismic velocity model and the atmospheric model are sufficient to explain the observed travel times.
FELT EFFECTS OF THE HEMEL HEMPSTEAD EXPLOSION OF 11 DECEMBER 2005
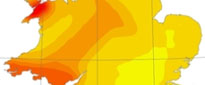
Initial reports suggested that the event was felt throughout the south of England. To study the felt effects of the explosion a survey was carried out. Members of the public were invited to complete the questionnaire on the BGS "Earthquakes" web site. Over 3000 completed questionnaires were returned, enabling us to produce the maps below. The results confirmed that the explosion was felt throughout a large part of England, with the most distant reports coming from as far north as Lancashire, West Yorkshire and Humberside, and as far west as Powys, Mid Glamorgan and Somerset.
Most reports of damage to property came from within a radius of 7km from the blast site. Examples of damage include: ‘three windows smashed’ from a house 1.4km to the southeast of the explosion; ‘French windows were blown in’ from 5.6km to the east; 'loft-hatch made of glass shattered' from 7km to the south; ‘roof tiles dislodged and fell to ground' from 3.7km to the northeast; ‘many windows shattered, one neighbour had a 42” TV blown across the lounge’ from 1.6km to the northwest; and ‘windows smashed and glass came in all over the bed and floor’ from 1.0km to the northwest. Numerous comments were received from people about the particular effects they felt. These included reports of car alarms being triggered, doors swinging open and closing, guttering and drainpipes rattling, banging noises, windows rattling, loft hatches being blown open and items of furniture being moved. Many people also reported that they had been woken up.
- The Buncefield Investigation Home Page
- The final report of the Major Incident Investigation Board
- Ottemoeller and Evers, 2008. Seismo-acoustic analysis of the Buncefield oil depot explosion in the UK, 2005 December 11, Geophysical Journal International, 172, 1123-1134
- Ceranna et al, 2009. The Buncefield explosion: a benchmark for infrasound analysis across Central Europe, Geophysical Journal International, 177, 491-508
- BBC report: Buncefield Explosions/